Faili:2020 Worldwide CO2 Emissions (by region, per capita), variwide diagram.png

Faili halisi (piseli 3,000 × 2,000, saizi ya faili: 706 KB, aina ya MIME: image/png)
,_variwide_diagram.png)
Muhtasari
| Maelezo |
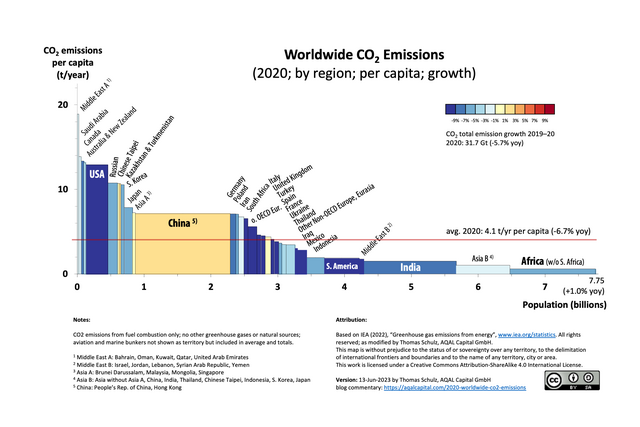
English: The variwide chart allows the visualization of a multitude of data dimensions in one easy-to-read diagram. These data dimensions are:
- Individual country data, such as China, South Africa, or the USA, or a group of countries such as the Middle East, Africa, or Australia/New Zealand, - Population by country or group of countries, - Per capita CO2 emissions, and - CO2 emissions growth year-over-year The total CO2 emissions of a region are represented as a rectangular area. The height of each rectangle is proportional to the CO2 emissions per capita and the width is proportional to the population of the represented region. The regions are sorted by CO2 emissions per capita, from the highest to the lowest. The color of the rectangles indicate their growth rate: “heating up” is represented from light red to dark red, and “cooling down” goes from light blue to dark blue. Based on IEA data from IEA (2022) “Greenhouse gas emissions from energy”, https://www.iea.org/statistics. All rights reserved; as modified by Thomas Schulz, AQAL Capital GmbH. https://aqalcapital.com/2020-worldwide-co2-emissions/ This map is without prejudice to the status of or sovereignty over any territory, to the delimitation of international frontiers and boundaries and to the name of any territory, city or area. License: This work is licensed under a Creative Commons Attribution-ShareAlike 4.0 International License (CC BY-SA 4.0) |
| Tarehe | |
| Chanzo | Kazi yangu |
| Mwandishi | Tom.schulz |
Hatimiliki
- Uko huru:
- kushiriki – kunakili na kusambaza kazi hiyo
- kwa remix – kurekebisha kazi
- Chini ya masharti yafuatayo:
- sifa – Ni lazima utoe mkopo unaofaa, utoe kiungo cha leseni, na uonyeshe ikiwa mabadiliko yalifanywa. Unaweza kufanya hivyo kwa njia yoyote inayofaa, lakini si kwa njia yoyote inayopendekeza mtoa leseni akuidhinishe wewe au matumizi yako.
Historia ya faili
Bonyeza tarehe/saa kuona faili kama ilivyoonekana wakati huo.
| Tarehe/Saa | Picha ndogo | Vipimo | Mtumiaji | Maelezo | |
|---|---|---|---|---|---|
| sasa hivi | 15:04, 13 Juni 2023 | | 3,000 × 2,000 (706 KB) | Tom.schulz | added missing data label for S. America |
| 18:40, 21 Desemba 2022 |  | 2,680 × 1,704 (683 KB) | Femke | remove superfluous white space | |
| 11:42, 12 Novemba 2022 |  | 3,000 × 2,000 (700 KB) | Tom.schulz | Uploaded own work with UploadWizard |
Matumizi ya faili
Ukurasa huu umeunganishwa na faili hili:
Matumizi ya faili ulimwenguni
Wiki nyingine hutumia faili hizi:
- Matumizi kwa en.wikipedia.org
- Matumizi kwa ha.wikipedia.org
- Matumizi kwa id.wikipedia.org
- Matumizi kwa zh.wikipedia.org
,_variwide_diagram.png)